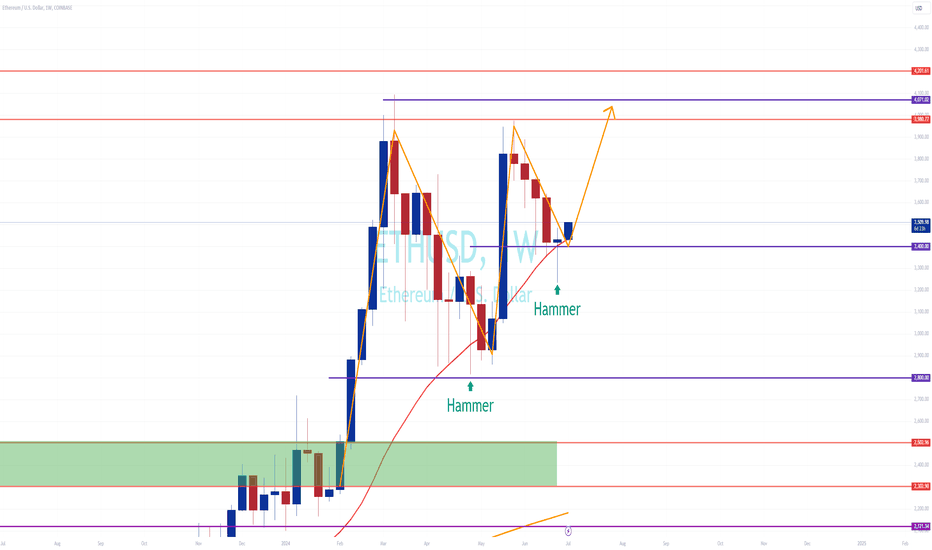
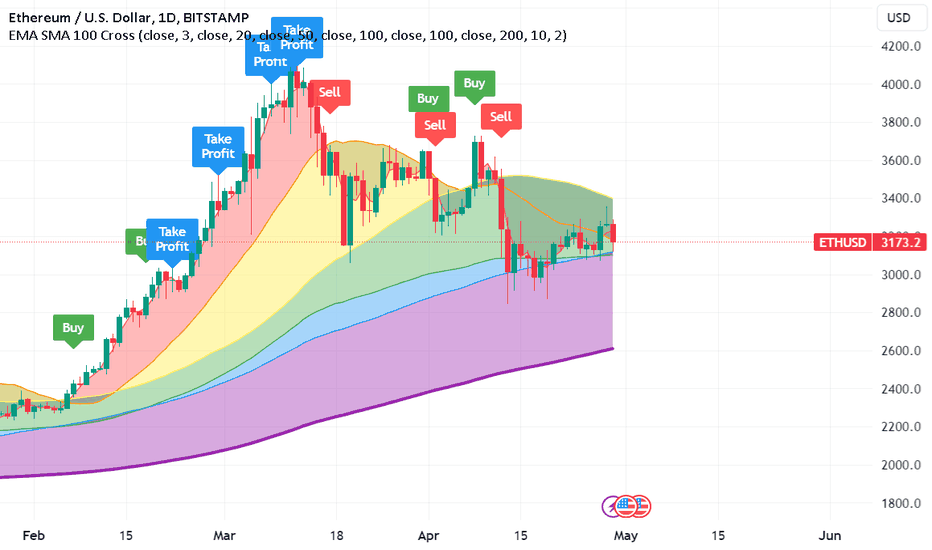
Price Trajectory and Moving Averages:
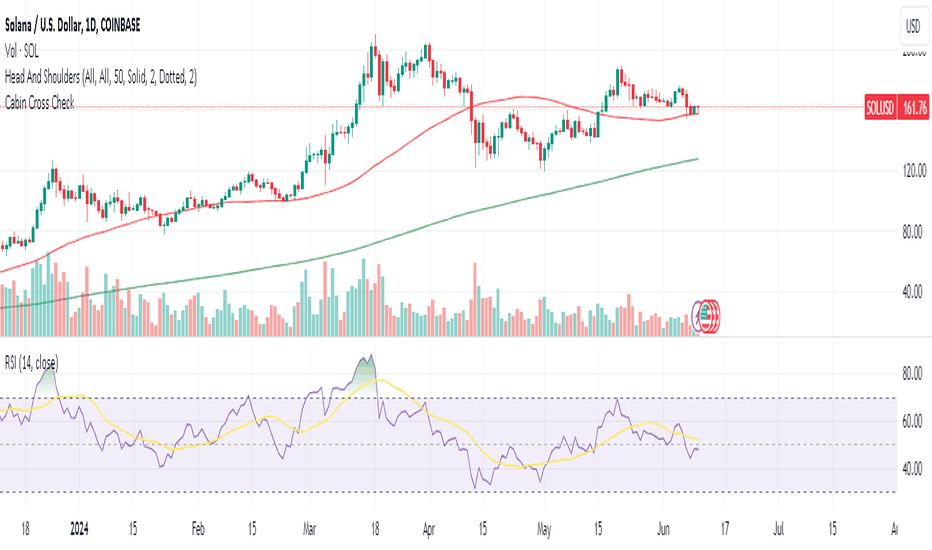
Solana’s price has retreated from its peak, with immediate trading below short-term moving averages (10, 20, and 30-day), which aligns with a bearish outlook. However, the longer-term averages (50, 100, and 200-day) are suggestive of possible support levels, indicating a bullish undertone that may unfold over an extended period.
Momentum Indicators:
The MACD reveals a bearish divergence, corroborated by a downward cross below the signal line.
The Momentum indicator reflects negative momentum, bolstering the bearish scenario.
Volume and Volatility Indicators:
The absence of notable volume divergence suggests that the price movement is not yet accompanied by a significant shift in trading...