```html
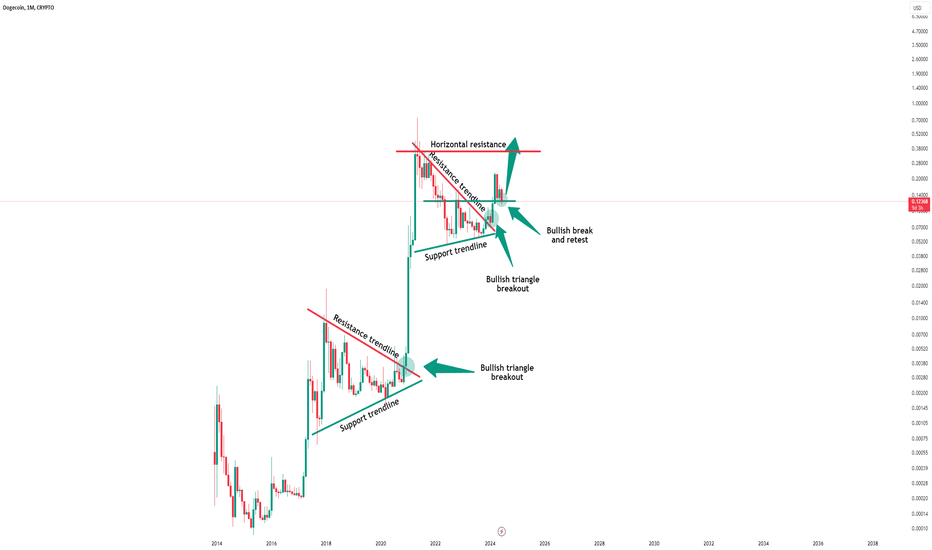
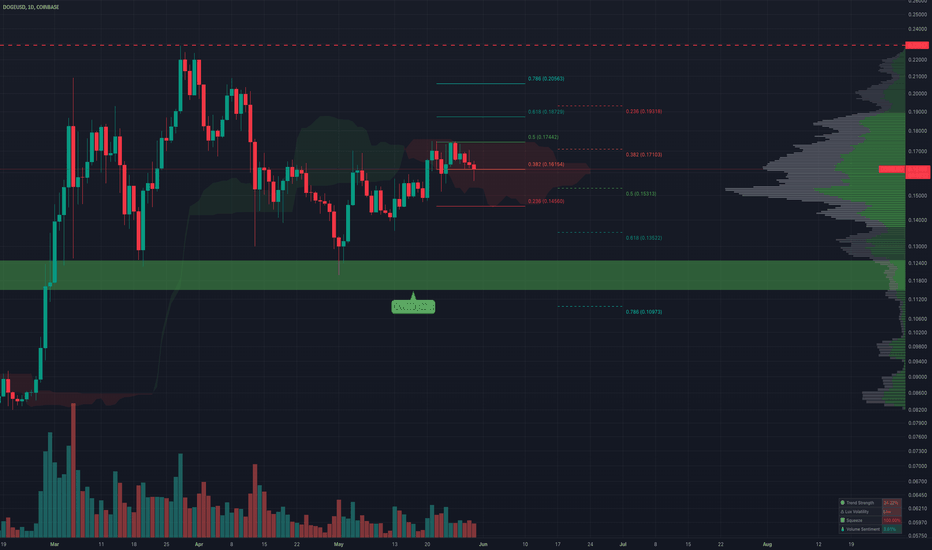
The 1D TF chart for Dogecoin
shows that the price is currently oscillating between significant Fib levels of 0.382 at $0.16154 and $0.17103, which are being tested as support and resistance. Additionally, the price is situated in the middle of the Ichimoku, indicating uncertainty and the potential for sideways movement. Yesterday's candlestick formed an Inverted Hammer Pattern, a Bearish Signal, while today's candlestick is forming a Hammer Pattern, a Bullish Signal, further confirming market uncertainty. Key support and resistance levels play a crucial role in determining the future direction of the price.
The support level at $0.15313 (0.5 Fib) is critical.
If the...