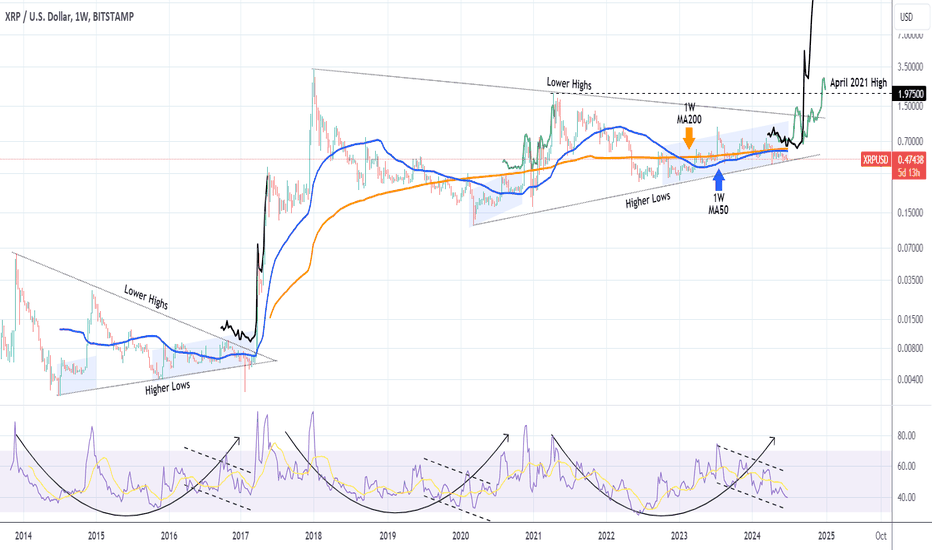
The XRP (XRPUSD) has been closing below both its 1W MA50 (blue trend-line) and the 1W MA200 (orange trend-line) since the week of April 08.
At the same time it is testing the bottom (Higher Lows trend-line) of the Triangle structure that started on the January 01 2018 All Time High (ATH).
In relative terms, it appears to be similar to the Triangle that started after the December 02 2013 High and broke-out to the upside on March 20 2017. Its 1W RSI is at 40.00, low enough historically to be considered a long-term buy opportunity.
Technically, the next time it breaks above the 1W MA200, it has higher probabilities of initiating the parabolic rise towards this Cycle's Top. If not, we're afraid that the XRP army will need a need narrative to hang on to, as the long-term pattern would have failed them.