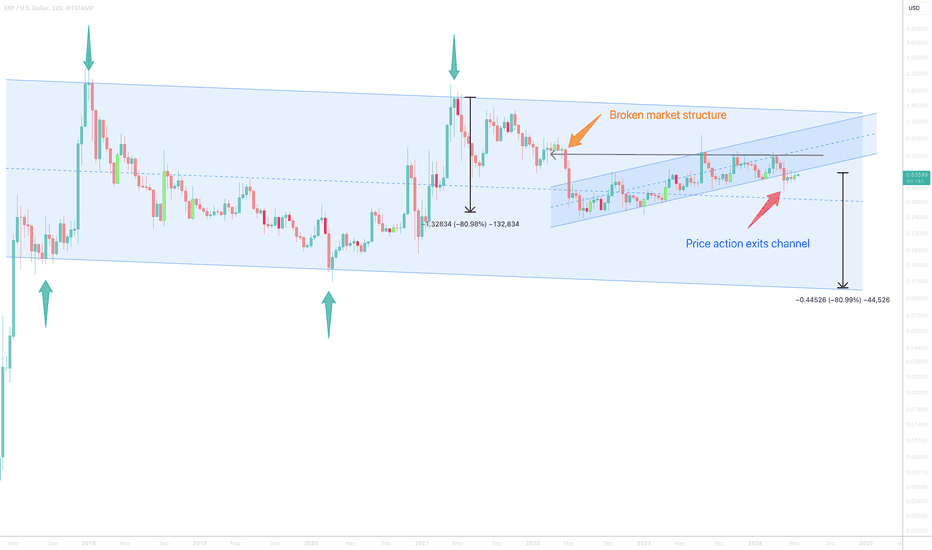
For seven years, XRP price has been trading within a clearly defined range, as indicated by the green arrows. Taking long or short positions from those areas would have proven to be profitable.
Over the past two years, the price has been moving within an uptrend channel. However, the channel support has recently failed, confirming a bearish trend (marked by the red arrow).
This failure comes after a double top formation in price action, where the market structure broke in April 2022 (indicated by the orange arrow).
The next support level to watch is at 30 cents, now that the price action has left the channel. If this support does not hold, the next level to look out for is at 10 cents.
While there is a possibility that price action could re-enter the channel and resume the uptrend, it is not considered probable at this point.
Down 10% is the current trade activity. A confirmation candle is forming on the 2-week chart below, indicating an exit from the channel and downtrend confirmation unless the bulls manage to push the price back inside the channel by Monday, June 10th. Failure to do so could signal a further downward trend ahead.