Unveiling the Falling Wedge: A Short-Term Boon on the 4-Hour Chart
Understanding the Falling Wedge
The falling wedge, as the name suggests, is a bullish reversal pattern. It's formed by two converging trendlines, with price action creating lower highs and lower lows, but at a decreasing rate. Imagine a wedge shape being squeezed from top to bottom, with the narrowing gap hinting at a potential price reversal to the upside.
This pattern signifies a period of consolidation where bears (sellers) are gradually losing momentum. While the price continues to fall, the decreasing distance between the trendlines indicates diminishing selling pressure. Bulls (buyers) start to accumulate, anticipating a potential breakout and price increase.
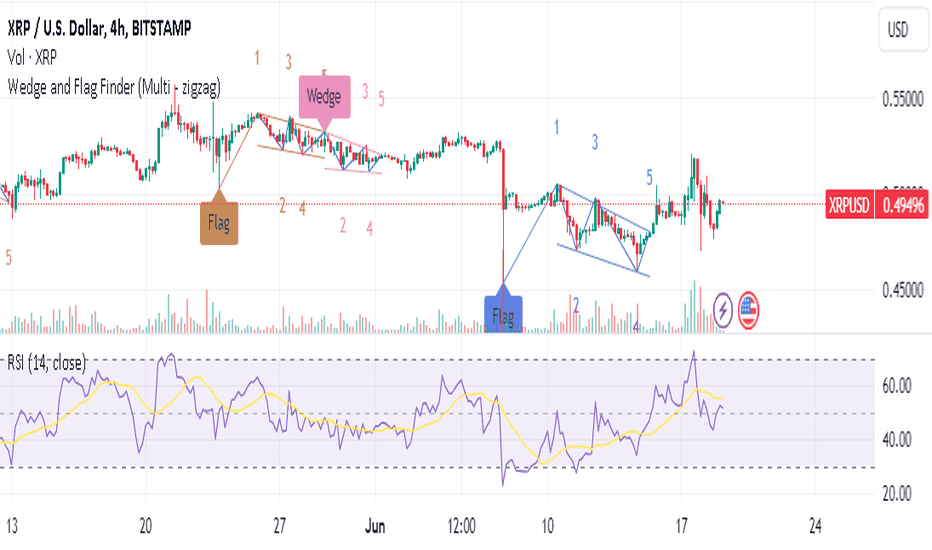
Identifying the Falling Wedge on a 4-Hour Chart
The 4-hour timeframe offers a sweet spot for day traders, providing a balance between short-term volatility and clear trend direction. Here's how to identify a falling wedge on your 4-hour chart:
- Trendline Construction: Draw two trendlines, one connecting the swing highs (peaks) and another connecting the swing lows (valleys). Ensure both lines are sloping downwards, forming the wedge shape.
- Convergence: Observe how the trendlines converge as the price action progresses. The closer the trendlines get, the more likely a breakout becomes.
- Volume Confirmation: While not a definitive indicator, an increase in trading volume accompanying the price move towards the wedge's apex (point of convergence) can strengthen the breakout signal.
Key Points to Remember:
- The duration of the wedge formation doesn't have a set timeframe, but longer wedges tend to have stronger breakout potential.
- The tightness of the wedge (how close the trendlines are) also influences the potential force of the breakout. Tighter wedges generally suggest a more explosive move.
- False breakouts can occur, where the price pierces the lower trendline only to fall back within the wedge. Proper risk management is crucial in such situations.
Strategies for Short-Term Gain
Once you've identified a valid falling wedge on your 4-hour chart, here are some strategies to exploit the potential short-term gain:
- Breakout Entry: Enter a long position (buying) once the price decisively breaks above the upper trendline. This breakout signifies a reversal in bearish momentum and a potential price increase.
- Price Target: Set your initial profit target at a level equal to the height of the wedge. Measure this distance from the breakout point and project it upwards.
- Stop-Loss Placement: Place your stop-loss order below the lower trendline of the wedge. This limits potential losses if the price falls and breaks the support level.
- Trailing Stop-Loss: Consider employing a trailing stop-loss as the price moves in your favor. This adjusts your stop-loss automatically, locking in profits while allowing for some price fluctuations.
Additional Considerations for Success
While the falling wedge offers a promising setup for short-term gains, remember that successful trading requires a holistic approach. Here are some additional factors to consider:
- Market Context: Analyze the overall market sentiment and any relevant news events that might influence the price action.
- Technical Indicators: Combine the falling wedge with other technical indicators like Relative Strength Index (RSI) or Moving Average Convergence Divergence (MACD) to confirm the breakout signal.
- Risk Management: Always prioritize risk management by using appropriate stop-loss orders and position sizing.
Understanding the falling wedge and the strategies discussed empowers you to identify potential short-term trading opportunities on the 4-hour chart. Remember, consistent practice, a balanced approach, and proper risk management are key ingredients for success in navigating the ever-evolving world of day trading.