
Bitcoin Surges to Record Highs: Latest Cryptocurrency Updates
-
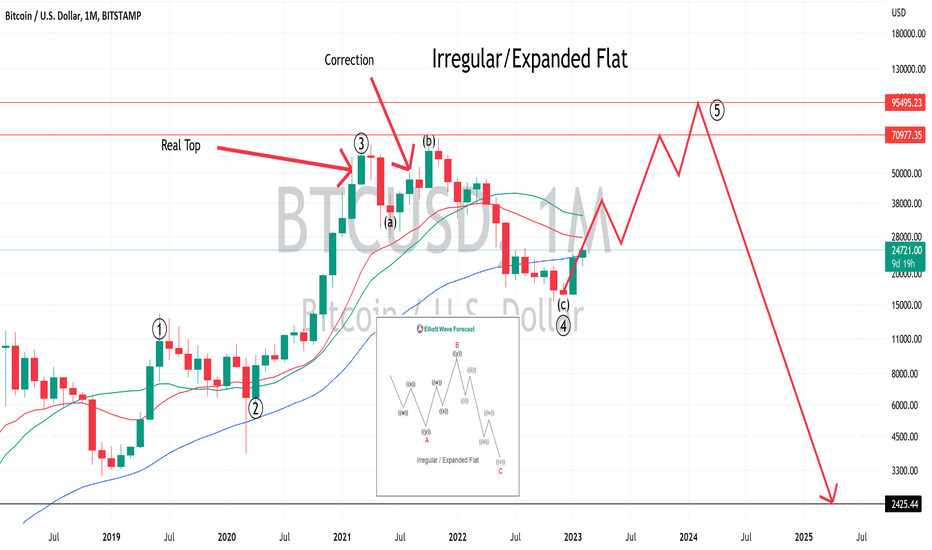
I anticipate that we are on track to reach a new all-time high, similar to the stock market before a downturn. I have shared my insights on the SPX in the provided link. Analyzing BTC's monthly chart, it appears we are in an expanded flat pattern. The peak in October 2021 seems to be a correction top in a three-wave structure, with April 2021 likely marking the actual top. I believe we are currently in wave 5, projected to reach between 70k and 96k based on Fibonacci extensions. Once surpassing the previous high, media speculation may push prices to 200k-500k, prompting FOMO buying. However, this could set the stage for a major Crypto crash. It's crucial to monitor charts rather than rely solely on opinions. This view is personal and not financial advice; please conduct your due diligence.
-
Remember the chart shared on February 19th, 2023? Although the dump has not happened yet, we are still anticipating its arrival.
-
Since analyzing this chart, I have observed additional indicators that suggest this scenario is increasingly probable. I will share more details shortly. Kindly consider boosting this post and following me to receive notifications when I publish the update.
-
BTC may experience a slight increase, but I anticipate it will continue to trade within this range for the remainder of the year before a potential final surge.
-
Like clockwork.
-
Just as I anticipated.
-
72,000, will we see a gradual decline from here onwards?
-
Pullback seems likely to occur soon, in my opinion, possibly down to $49,000.
-
Slow decline towards the $49,000 mark. Considering purchasing during the final push upward at $49,000. This is not financial advice. Remember to like and follow for updates on my future posts.
-
Temporary relief may be on the horizon as Bitcoin's price is expected to reach around 56-57k soon.
-
Option 1 Option 2
-
Both choices lead us to a level around 2k.