
Bitcoin Price Prediction: Will BTC Surge to $110-120k Soon?
-
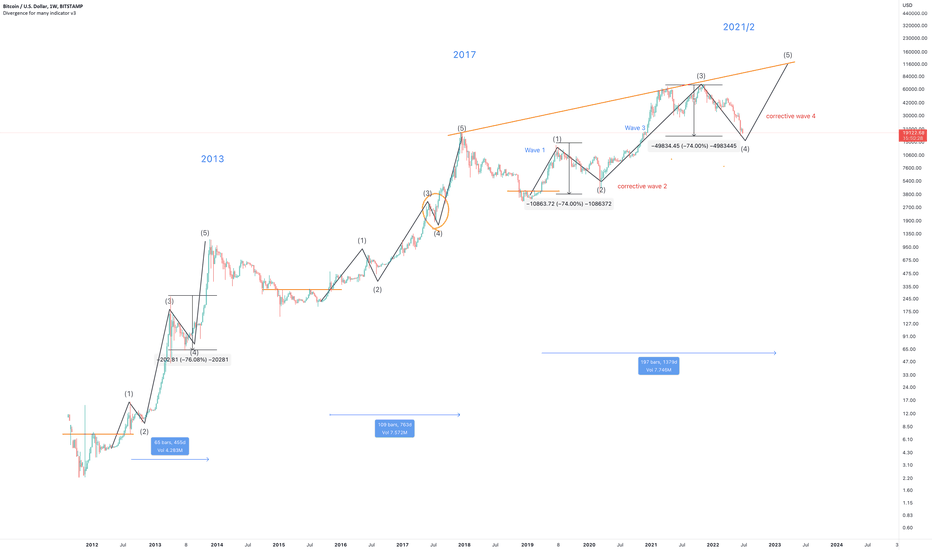
Very likely within the next 6 to 9 months. This concept stems from the discussion: "Is Bitcoin on the brink of dropping to $20k?" released in December. You can find it at tinyurl.com/35bp2xc8. Initially, the $20k target was centered around a wave 4 Elliot wave correction, signifying a strong sell signal on the weekly chart. However, the current scenario has reversed. There's a high probability of a Wave 5 rally with a robust buy signal. Remarkably, this is the first 'remarkable buy' signal I've observed on a Bitcoin weekly chart, regardless of the exchange. Anticipated objections may be: "This isn't just a wave 4 correction; it indicates a bear market!" While technically correct that it signifies a bear market, it doesn't imply a crypto winter. This resembles a significant wave 4 correction similar to those witnessed in past cycles, such as: 1) July 2019 to April 2020 2) April 2013 to August 2013 Both corrections saw approximately 75% dips, followed by notably strong rallies. ** Extending cycles ** I'm a proponent of the lengthening cycle theory, initially introduced to me by Youtube's Benjamin Cowen. When overlaid with previous cycles, it suggests that the market peak for this cycle could be at the earliest in 6 months, or at the latest, within 9 months. The elongated cycles are depicted on the weekly chart above. How will the rally unfold? According to the weekly chart below, a surge towards the $48k mark before September is expected, offering an excellent swing trade opportunity. What are the fundamental catalysts behind these developments? Risk assets globally are poised for similar changes. Forecasts hint at an impending recession, or in some cases, already in one (depending on the country), alongside escalating rates. The Fed will likely need to adjust its course if economic growth continues to slow. Once investors catch wind of a potential rate adjustment... The other part driving this growth surge is the dwindling demand coupled with escalating inflation. As rates rise, individuals are becoming increasingly cautious with expenditures while stores are grappling with excess inventory. It's apparent that inflation has peaked and is expected to recede significantly in the coming months amidst rising rates. The conjunction of rate adjustments and diminishing demand presents an uncommon scenario not often witnessed; one must look back several decades to find a similar instance. Queries? Feel free to ask below! Type: trade Risk: <=40% of portfolio Timeframe: 6 - 9 months Return: 6x Weekly chart
-
Forgot to specify a 'go long' from which price area. Are you prepared? Where is the price bottom? Keep moving forward... Avoid attempting to time the market! No one can accurately pinpoint the bottom. Despite this, a few individuals have reached out inquiring about this very question. On the 2-day chart displayed below, the price action is consolidating within a narrow range inside the falling wedge pattern, leaving minimal room for adjustments. Once a breakout occurs to the right of the orange line, consider entering a long position. Following this breakout, the price swiftly surges to $48k – check the historical data. The green vertical lines act as indicators for potential market bottoms. The green 300-week Moving Average (MA) has consistently acted as a strong support level that price action has never breached. Currently positioned around $17k and trending upwards, it suggests that there are remaining sellers hoping to offload their positions. Placing a limit order around these levels might prove advantageous if luck is on your side. The 'incredible buy' signal is dependent on certain conditions (highlighted in red circles) and is yet to be validated. Once the confirmation is received, the corresponding label will be visible on the chart. I will consider activating this trading idea once the confirmation is confirmed, if I recall to do so.
-
** Strong market bottom signal ** I find it fascinating to analyze data, especially when the majority sentiment is bearish. This contrarian outlook often signals a strong market bottom. It's important to remember that 95% of investors typically lose money, with many making decisions based on short-term predictions like "$10k is next bro, I’m short." Selling at a loss is a common mistake that inexperienced traders make repeatedly. Analyzing the 10-day chart, I noticed a long-forgotten alarm signal that just triggered. The 700-day EMA (yellow line) and the 150-day SMA (red line) are two key moving averages to watch. The historical data shows a clear correlation between the crossover of these moving averages and market bottoms. Furthermore, observing the time it took for the price action to touch the 150-day SMA after the crossover reveals a potential price target of $34k before August 10th. This projection considers data from multiple time frames, not just the current chart. In conclusion, this analysis provides valuable insights for informed decision-making in the cryptocurrency market. Happy trading!
-
Daily chart shows a bullish divergence forming on the long-term 300-day/weekly moving average. Bears, get ready as short positions may soar to new heights.
-
The inverse head and shoulders pattern displayed on the 1-day chart holds more significance on Stochastic RSI than on price action, indicating an upcoming surge in momentum. Such occurrences are rare, emphasizing the importance of taking action. This particular inverse head and shoulders formation is more extensive than the previous one, likened to a slingshot being pulled back even further.
-
Trade update: Four charts are on the rise. As mentioned earlier, the 'incredible buy' signal, indicated by the red circles, was conditional and awaited confirmation. Once the signal was confirmed yesterday, it became trade active.
-
There are numerous messages circulating about the bear flag currently forming on the 18-hour chart below. Discussions speculating on price movements such as " $12k is next bro, as per such and such on Youtube…" and " $16k will break then $12k" are prevalent. While such outcomes are feasible given the unpredictable nature of the market, they are not necessarily probable. Analyzing the 2-day chart and a closer inspection below reveals several indicators favoring a bullish scenario: 1) Presence of a buy signal corroborated by historical data and the green strip marking the market bottom. 2) Price action aligning with the 0.618 golden zone. 3) Bullish divergence observed with Stochastic RSI and MACD. Given these factors, I would confidently consider longing this chart consistently. It is advisable to exercise caution regarding information sourced from social media platforms.
-
This individual appears to have a solid understanding of the topic at hand! ;) [Link to the video at 0:50](youtu.be/QaTn5eCWT48?t=50)
-
The Melbourne headquartered exchange, Eightcap, has issued the first 'pi-cycle' bottom alert. We anticipate that other exchanges will follow suit and print the alert within the next 24 hours.
-
This information was shared with me, and I cannot claim credit for it. I was advised to examine the fractal pattern from the 2019 correction to the current period. Always remember to verify information yourself. After verifying, I found it to be quite remarkable. The comparison shows the 2019 correction overlaid with the current correction. If this fractal pattern continues to unfold as it has been, the price is projected to be around $30k by the end of July or the beginning of August, with expectations of reaching the mid-$50k range in September.
-
**Pi-Cycle Bottom** Major cryptocurrency exchanges are currently indicating the pi-cycle bottom with significant volume. This labeling has occurred only twice before. Is this the bottom? There is a high likelihood, with a margin of approximately $10.87, considering the unpredictable nature of this market.
-
Amazing to see how accurately this fractal is predicting price action. If this pattern persists, we could potentially reach $25k within the next three days.
-
For the third time ever, a 'great buy' signal has appeared on the 5-day chart. Are we still anticipating $12,000?
-
Have you observed the current shape of the weekly logarithmic growth curve chart? The symmetry is quite impressive, indicating a clear target ahead. It is projected to reach $48k by September or October at the latest. During that period, there will be a significant swing trading opportunity as the majority of the market, 95% club, will enter at a much higher price of $17k. As part of the 5% club, it is important to maintain good relations with them for liquidity purposes.
-
Better act fast before Ben makes a 40-minute YouTube video on this topic. Bitcoin's price action has formed its first positive weekly Heikin Ashi candle since the sell-off, marking a trend reversal not seen since January. This particular candle, known as an 'inverted hammer,' has appeared green, indicating two key points: 1) Bulls penetrated deep into seller territory with minimal resistance, and 2) Sellers seem depleted. This reversal pattern holds significant power, as explained in my previous tutorial: tinyurl.com/487jttmu. The upcoming weeks promise excitement, so maintain focus amid fluctuating sentiments. Notably, a rare 'incredible buy' signal has emerged on the weekly chart, a first across all exchanges. This signal signifies that the recent sell-off rendered Bitcoin the most oversold ever, surpassing the March 2020 drop.
-
A multitude of speculations are circulating, with some predicting a dip back to $17k and others suggesting $10k as the next target. Amidst the fervent emotions, it's crucial to remember the significance of studying the charts. In basic technical analysis: 1) Observing historical data reveals that the 300MA has been a reliable indicator, marking $19.5k as a crucial level. 2) Noteworthy is the recent breach of price resistance, now turned support, along with a similar pattern on RSI resistance. To those caught up in the speculation frenzy, it's advisable to remain calm and collected.
-
Monthly price action concludes near the 50-month moving average (blue line), exhibiting a striking resemblance to previous corrections in 2018/19 and 2014/15. Notably, the candle bodies in the current correction closely mirror those from the mentioned periods. Drawing parallels with the 2018/2019 bars pattern correction overlaid on today's correction, there is speculation of reaching $70k by the year-end.
-
A brief poll with a 95% / 5% split: Do you believe Bitcoin will hit $27k before the middle of the month? Respond with a simple "Yes" or "No" below!
-
A significant number of inquiries revolve around concerns about potential downward trends, with speculations circulating about Bitcoin dropping back to $17k and possibly lower. For those feeling anxious about price fluctuations of around $1k, it's crucial to remain steadfast as such minor swings are commonplace during market cycles. Take a look at the daily chart – do you notice the formation of an ascending triangle pattern? And for a bit of entertainment, let's examine the last 5 days displayed on the 30-minute chart!
-
Weekly stochastic RSI has recently crossed above 40 (as indicated by the red circles) after signaling the strongest buy signal ever. Despite a 10% rally from $22k since the last update, many retail traders are now considering shorting this market. It's crucial to shift away from this bearish bias promptly to avoid potential regret down the road.
-
What's about to occur next might catch many off guard, all revolving around the red circles visible on the 6-day chart below. When price action surges to the 20/21-week SMA (bull market support band), typically around $27.3 to 27.5k, the market heats up significantly. A break above this level signals a shift from bearish to bullish sentiment. Subsequently, an explosive rally to the 50-week SMA (blue line) at approximately $37.5k to $38k is expected. If these milestones are met, a push towards the previous all-time high is probable. Finding solid ground at $48k, regardless of the all-time high, is crucial. Achieving this level lends confidence to the overall projection due to insights from the log growth curve in historical data.
-
While many are extremely pessimistic about the market, the current analysis of the 6-hour chart indicates that Bitcoin has successfully broken out of the ascending triangle pattern and is now stabilizing at previous resistance levels. Based on the flagpole measurement, the projected target price is approximately $30,000, causing excitement among the majority of investors. Do you find periodic updates helpful or bothersome? Your feedback is valuable to me. Sending private messages frequently can be intrusive, so I believe sharing updates this way is the most efficient method of dissemination.
-
Thanks for the feedback. I'll be sure to keep the updates regular as long as there's relevant information to share. One recurring observation that consistently emerges is the presence of bear flags. It is crucial to accurately draw these bear flags, as many examples on trading view exhibit confirmation bias, in my opinion. On the daily chart provided: 1) In the last bear flag (#3), the price action broke out of the upper channel and retested previous resistance as support. Some examples on trading view tend to overlook the first two candle bodies when plotting the bear flag, instead focusing on the wicks. This approach is not recommended, as the bodies convey factual information. 2) The declining angle of the rising price action within these bear flags indicates that buyers are not eagerly entering the market each time the price recovers. This signals a potential opportunity to show interest when the crowd sentiment diminishes. 3) Lastly, let's not forget about support and resistance, the basics of Technical Analysis. A breakout above price action resistance is great news for bulls monitoring the development of these flags. This morning, someone reportedly sold over $6.4 billion worth of BTC. Could it be Saylor, or was it part of a larger liquidation event? If you have any insights, please share below.
-
8 days ago, a 30-minute chart was shared above as a lighthearted gesture, coinciding with a notable buy signal. Subsequently, the price surged by $2k, reflecting a familiar pattern once more.
-
This 3-day chart update is valuable to share as it offers an insightful analysis. It showcases the familiar chart from yesterday, now integrated with the Bollinger Band indicator. What makes it intriguing? 1) The price movement is currently testing the Bollinger Band mean while also backtesting the Bear flag breakout. By referencing historical price levels, one can gain valuable insights. 2) Notably, the Bollinger Band mouth is narrowing towards the price action. This indicates two significant aspects: - The current trend in price action is showing signs of weakness. - A substantial price movement is on the horizon. This detailed analysis suggests that critical market movements are forthcoming.
-
Well, a significant movement has occurred, and the band's prediction was accurate! The question now is whether this is a bear trap or if the price is heading towards $10-12k as many online sources are suggesting. The drop from $25k to $22k within 72 hours is undoubtedly noteworthy. What's intriguing about this decline is that it was driven by buyers stepping in at the $18k lows, not by the initial sellers. These sellers have already left the market. In terms of market activity, it seems to be following a typical pattern. Looking at two daily charts: Trading 101 - support and resistance On the 1-day chart, the price action breaks through both diagonal and horizontal resistances, with the correction landing at the golden ratio, which also coincides with previous resistance levels. Trading 102 - the trend By observing the Heikin Ashi candles to analyze the trend, we notice lower highs and lower lows in price action. However, the essential point is that the trend has convincingly surpassed resistance levels. The timing of the confirmation of support, whether at $21k or now at the golden ratio, is not critical. A Friday close above $22.2k would provide further confirmation that the 50-day SMA is acting as reliable support, as seen in previous instances (red circles).
-
An 'amazing buy' indicator has recently appeared on the 4-hour chart, suggesting a potential 20% upward movement. Moreover, the price action is currently outside the Bollinger Band (marked by red circles), with around 90% of all price movements typically clustering around the mean (illustrated by the red/green line).
-
Trade active: ** Hash ribbon alert ** The well-known hash ribbon indicator has been activated. This indicates that miners have finished capitulating. There has never been a false signal in Bitcoin's price action history.
-
A couple of updates: Regarding the weekly chart, the red boxes remain unchanged and appear to be a direct clone of each other. Observing the fractal pattern in the price action is impressive. The price action is declining from the same level of support and then consolidating after the 'buy' signal. It is intriguing to ponder whether the fractal will continue, as this marks the first instance in Bitcoin's price history where an 'incredible buy' signal has been indicated on the weekly chart. In the short term, a significant upward movement seems highly likely. The 4-hour chart shows the Bollinger Band constricting, suggesting an imminent substantial price swing. Currently, the price action is confined within a falling wedge pattern, hinting at a major breakout around August 24-25th.
-
25th is here... Day after day, the market has been stagnant, but could a change be on the horizon? Looking at the 8-hour chart, it's evident that: 1) Price action has retraced to the golden pocket. 2) The Bollinger Band is constricting tightly, indicating an imminent strong move. It's possible that we may see price action retrace back to the mid-$30-35k range soon. The market has effectively cleared out weaker positions within the $18-25k range.
-
Looks like the price movement is gearing up for a re-test of the lows seen in June, hovering around the late $18k to early $19k range. This potential move has the potential to create a strong bullish divergence on the weekly chart.
-
Forget about the previously predicted $18-19k targets. Based on my recent analysis, the likelihood of that happening is very low. There is a lot of speculation circulating today, with concerns about the price dropping below $20k, then hitting $17k, $13k, and possibly even lower. However, it's essential not to panic. In the grand scheme of things, a fluctuation of around $3k will likely appear insignificant a year from now. In short, the chances of the price dipping below $20k are slim, currently only about 3% away. The recent market behavior indicates that the bottom has been reached. The current sellers are not the same ones who drove the price down to the previous low, which is quite remarkable. Around 90% of those who sold today did so at a loss compared to when they initially bought in, and now they are only $2k away from breaking even. Isn't that astounding? How can I be so confident that the bottom is in? Well, just consider the following factors: 1) Pi-cycle bottom alert. 2) Hash ribbon. 3) The first-ever weekly 'incredible buy' signal on the weekly chart. And the list goes on. If the previous low indeed marks the bottom, where will the next higher low be established? A pertinent question for sure. Let's analyze the historical data. Looking back at the last correction to the 200-week MA in January 2019 (excluding the extraordinary events of the March 2020 Black Swan Covid incident), the following sequence occurred: 1) The 'incredible buy' signal was activated. 2) The 'pi-cycle' bottom alert was triggered. 3) Price action witnessed a rally and correction. 4) Hash ribbon indicated a 'buy' signal. 5) Price action established a higher low at the 0.236 Fibonacci level. Fast forward to August... Boom! Price action is expected to establish the next higher low around $20k, possibly reaching $20.2k. Stay informed and keep a close eye on the market movements.
-
I'm not familiar with this individual, but it's interesting to see a Youtube video aligning with the Elliot wave theory mentioned here. The market seems poised to embark on a final wave 5 push, leading to a stock market surge before a potentially lengthy bear market of up to 2 years. You can watch the video at www.youtube.com/watch?v=V9Y5_2Xy...
-
The 10-day chart is showing a 'great buy' signal, despite some predicting lower prices ahead. The charts continue to suggest a different narrative with uncertainty about future price movements. The last time a 'great buy' signal appeared on this chart was in January 2019, leading to a nearly 300% rally.
-
A robust bullish divergence is forming on the 4-hour chart, indicating potential upward momentum.
-
Everyone is observing the descending wedge pattern, indicating an imminent significant market movement expected by September 15th.
-
Very impressive 'W' formation pattern seen on the 4-hour chart over the past week. I am curious about the identity of the significant seller, as analysis of on-chain data suggests this is not typical retail selling activity. The truth will likely be revealed in the forthcoming weeks and months, as both retail investors and miners appear to be fatigued. Who could this seller be? Notice the lower supporting trend line? Now observe the same line when zoomed out on the 2-week chart. It truly is intriguing, isn't it?
-
Ready for September? Statistically speaking, September is historically the worst month of the year for Bitcoin. Brace yourselves for potential further declines in the market. Speculations around a drop to $17k, then $14k, and possibly even $12k are circulating due to impending events such as the Mt. Gox sell-off, anticipated FED rate hikes, and the continuous printing of the dollar. Additionally, global uncertainties like the situation in Europe and concerns about China's economy are adding to the pessimistic sentiment. However, let’s take a step back and look at the facts presented in the charts for a more informed perspective. Considering the latest market indicators, it appears that the market may have found its bottom. The IB signals on the 2-day chart are quite significant and not to be overlooked. The price action has notably landed on the 0.786 Fibonacci level, similar to the pattern observed during the December 2018 correction. While moving averages are not always reliable predictors of future trends, the current distance between the 2-day/200-day SMA (Red) and the 2-day/50-day SMA is at its widest, surpassing the levels seen during the 2018 correction. This indicates an extreme oversold condition for Bitcoin, a situation that has not been witnessed before. Considering these technical analyses and market conditions, it raises the question: amidst all the doomsday predictions, is it rational to expect further significant declines in Bitcoin's price? Looking back at historical data and patterns, there may be a potential for a different outcome. Let’s observe the market dynamics closely and stay informed to make well-grounded decisions in these uncertain times.
-
Today's intriguing statistic for November 2020: The last month where buying Bitcoin would result in a profitable sale today. According to Glassnode, the FOMO-driven buyers of 2021 are currently experiencing losses upon selling. Remarkably, only those who bought in 2020 or earlier are selling at a profit today.
-
The previous prediction has materialized! A staggering $90 million in Bitcoin has been liquidated within the past 48 hours from a dormant Bitcoin wallet dating back to 2013. Such resilience is a testament to the concept of Diamond hands. Alternatively, this could signify the release of Mount Gox holdings.
-
'The predictions of a $12-13k price point are once again gaining momentum. Despite the current downtrend breaking the June lows on the weekly candle bodies, there is no cause for alarm. A significant bullish divergence is forming on the weekly charts, as indicated by the money flow index (MFI) and nine oscillators showing divergence patterns. The crucial support level stands at $17.5k for now. Looking back at past weekly divergences, we can appreciate their significance. In closer examination on the 6-hour chart, a falling wedge pattern followed by a breakout and successful backtest is evident. Overall, the market sentiment remains positive.'
-
Bullish divergence is evident on the daily chart with the money flow index - have you spotted it?
-
If the price action breaks into the bear flag instead of confirming it as resistance, we may witness a 'whipsaw' effect. Keep an eye out for this confirmation in the next few days as a 'whipsaw' formation is considered one of the most bullish signals to watch for.
-
Price action is currently situated at the lower end of the bear flag pattern. It wouldn't be unexpected to see an influx of emotional sellers driving the price back towards the $20k range. Following yesterday's liquidation of numerous short positions, there is a strong possibility that these traders will be eager to recoup their losses.
-
A few posts back, I discussed the 'Whipsaw' pattern, which can catch pattern traders off guard by initially confirming a direction and then abruptly reversing. This pattern can serve as a strong bullish or bearish signal, depending on individual perspectives. The bear flag no.3 on the daily chart was anticipated to push price action towards $12k, a common prediction among YouTube analysts. However, the price unexpectedly surged to test the bear flag support, which ultimately acted as a strong resistance due to overwhelming demand. Analyzing the 5-hour chart reveals a breakout from a rising wedge pattern, with a potential near-term target of $24.5k. Achieving this price level would effectively confirm the 'Whipsaw' signal. Additionally, the weekly chart shows bullish divergence in the price action, indicating a potentially positive trend ahead.
-
**Trade Alert:** Cryptocurrency traders, brace yourselves for an imminent monumental price shift in Bitcoin, estimated at around 50%. This impending movement is poised to catch many market participants off guard, but not those who are well-informed. In a groundbreaking development, the latest analysis of Bitcoin's 3-day chart reveals an unprecedented occurrence of '5' bullish divergencies aligning with the price action. These divergencies, identified over a 30-day span, signify a potential bullish upswing. While I am unable to disclose detailed insights on the ongoing probability indicator signals due to confidentiality reasons, the surge in bullish divergencies highlights a significant potential for a substantial price movement in Bitcoin's near future. Stay tuned for further updates and be prepared for exciting trading opportunities ahead.
-
The next price target is just above $23,000. It may consolidate around that level before potentially moving towards the $30,000 to $32,000 range.
-
The anticipation of a price surge to $10-12k is resurfacing among traders. My advice to them is to consider capitulating and relieving the pressure. The current price action on the 10-day chart shows a significant tightening pattern, possibly leading to a breakout. Surprisingly, the price has held within this wedge for an extended period, with a previous spike to $24k before a correction. Such movements often indicate imminent volatility. A breakout from a wedge typically occurs around 70% into its formation, suggesting that further consolidation could result in a more robust market momentum.
-
Liking this insight from TradingShot.
-
On the 5-day market chart, there are two significant indicators: 1) The NVT + HV indicators have turned green. 2) Price action formed a higher low within the golden pocket during this transition. These conditions were last observed back in March 2019.
-
July 3rd marked the publication date of this concept. At that time, the price was slightly above $19k, mirroring the current price. This pattern resembles a double bottom formation. In September, close attention was paid to the influx of Bitcoin into exchanges. A significant amount was noticed, predominantly originating from legacy wallets and leveraged exchanges. A crucial factor for substantial market uptrends is a decrease in exchange inflows. This trend has consistently preceded the onset of bull markets. Presently, there are indications supporting this observation.
-
PS: There is emerging evidence suggesting a potential target adjustment to $140,000. To learn more about the reasons behind this prediction, please visit the Patreon page.
-
An alarm I set 2 years ago recently went off, indicating that the volume of Bitcoin traded is double that of the crash in March 2020. This significant increase in volume is a bullish divergence. I am unsure about what is going to happen next, but it definitely won't be dull!
-
It is impressive to see how many sellers are still active at these current levels despite Bitcoin's price holding steady for nearly four months. Bitcoin has shown more stability than most fiat currencies during this time period. The weekly chart indicates ongoing accumulation without significant changes. There is a noticeable bullish divergence on the weekly chart, hinting at a potential upward movement. Speculations suggest a substantial price increase towards $31k by the second half of this month, which could catch many off guard. If the weekly candle closes above $19.5k, it could confirm the previous bullish signal.
-
9 months ago I made this comment: 'Wow, it would be fantastic to purchase Bitcoin for under $20k - not gonna happen bro' Today: ‘You’re too early, going to $12k’ Just received an alert on the 2-week chart. Something significant has occurred. 1) Stochastic RSI crossed above 20 (blue circles below). What does this mean? It's the longest period since crossing below 80 before: 2) A strong buy signal (not depicted) 3) The 'pi-cycle' bottom alert. Still doubting if the bottom is in? It's remarkable to think that 3 months after sharing this idea, the price action remains at the same level. During this time, the majority of investors have transferred their tokens to a few. The 10% express their gratitude to the 90%.
-
2015 was the last time we saw numerous oscillators indicating bullish divergence with price action over a 3-month period on the 5-day chart. This presents an exceptional trading opportunity that should not be overlooked. Despite a $3.5k drop since this post was published, with a new lower low at $15.5k, this minor decrease is insignificant compared to the potential future developments. Keep a close eye on the 5-day chart for further insights.
-
Continue to add to long positions from the $19.7k level in the 12-hour timeframe.
-
After reaching $20.5k, the bullish momentum is expected to accelerate. The weekly ribbon indicator has recently turned green, signaling a strong buying opportunity (indicated by the blue circles). Historically, when this buy signal occurs, prices tend to rise for at least six months on the weekly chart. The breakout from the falling wedge pattern was a classic move, accompanied by significant trading volume. While there may still be some retail traders to shake out within the Wyckoff accumulation pattern, once this process is complete, the wedge target of $120k could be achievable. As for the timing of this price target, it remains uncertain, but the likelihood of it materializing is high.
-
Is the price action poised to break through the $25k resistance level and surge towards $27k? Many traders are currently expressing bearish sentiments.
-
A potential surge to $25,000 is anticipated in the upcoming days, as indicated by the 4-hour chart analysis.
-
Price action has currently broken out of the bottom of the falling wedge on the 4-hour chart after reaching the apex. If the price drops below $19k, it presents a great buying opportunity. It is unlikely for the price to stay below this level for an extended period.
-
Price action appears to be on the verge of surging to $36k as it consolidates between the bullish market support band (21-week SMA) and the 50-week SMA (blue) on the weekly chart. The recent green colour flip of the 21-week SMA indicates a bullish signal. If the resistance at the 50-week SMA is breached, there is potential for the price action to advance towards $36k with minimal resistance in between.
-
Despite the bears' best efforts, the 50-week SMA was broken with significant volume. Bears are selling at discounted prices, creating a need for entry liquidity. Resistance is expected at $36k (marked by the orange dotted line, the GRM). It may take some time, with day traders securing profits, but we remain patient. Weekly fluctuations are to be anticipated.
-
On the daily chart, a pennant formation has emerged signaling a breakout. From a technical standpoint, this indicates a potential target of $40k. For the bulls, if the price action falls below $27.5k, this breakout may be a false signal. As for the bears anticipating $10k levels, is that really a serious prediction? 😳
-
So many inquiries about a potential correction to sub $20k levels, but that scenario seems unlikely at this point. For those who sold below those levels, thank you for your contribution. Price action has been consolidating around $28k for a while now, a common occurrence when breaching log growth curve channels. The resistance at $28.5k marks the entry point into the channel. A move beyond this resistance could propel prices towards $60k at the upper channel boundary.
-
**For pattern traders** The 2-day chart reveals a candle body forming above the resistance level. If today's price action closes above $30k, the flagpole predicts a potential move towards the $39k area, indicating a significant 4x increase that may surprise the bears. Keep a close eye on the 2-day chart for further insights into the market trends.
-
The 5-day chart displayed above has been monitored for some time, and recently, an alert caught my attention. While I typically do not favor moving averages due to their lagging nature, the symmetry in this chart cannot be ignored. Interestingly, the moving averages on this chart are not the commonly used SMA, EMA, or WMA, but rather RMA or Rolling Moving Averages. Unlike the Simple Moving Average, the Rolling Moving Average assigns varying weights to price data as the average is calculated, giving less weight to later data points. The chart shows the 5-day/100 RMA, 5-day/200 RMA, and 5-day/400 RMA from top to bottom. Observing points '1' and '2' can provide valuable insights for Monday morning analysis, as historical patterns have indicated at least a 50% price increase when these points act as support. In Wave 5, the final wave for the crypto market, corrections in price action are expected, with the first corrective wave, wave 2, anticipated soon. Stay tuned for more updates on this developing market trend.
-
A recent signal has emerged on the weekly chart, comparable to occurrences in October 2020 and March 2019. In those instances, price action surged by 400% and 200% respectively. Have you identified what this signal indicates for the current market?
-
Trade update: Closing 31k swing trades with a high likelihood of a 50% upward movement.
-
Up 15% since the last update, with the next resistance level at 40k.
-
Price action needs to surpass the 30k mark by the month's end to avoid a potential 12 to 18-month setback. Further details on this will be elaborated on elsewhere. The notion of reaching 48k remains unchanged at this time.
-
Anticipate a significant price movement happening sooner than expected.
-
On the current 4-hour chart, sellers are consistently presenting chances to initiate long positions.
-
Quite possibly the most significant two candles to appear in 2023 on the two-week chart. I have been monitoring these candles for some time now. Why are they important? The GRM support has recently been confirmed on the two-week chart (indicated by the yellow dotted line). By looking at previous tests and confirmations on the zoomed-out two-week chart below, you can see the significance of this confirmation. The current candle pattern in 2023 bears the closest resemblance to the one observed in 2015.
-
12 hours later, it's important to avoid making impulsive decisions due to fear of missing out. Sellers may offer another opportunity in the future, so it's best to stay patient and not rush into anything.
-
Wait for the sell-off on Monday to conclude before considering long positions. It is crucial for the support level at 29k to be tested before any further upward movement can be expected.
-
Since July of last year, this pattern has been extensively documented within this concept. It continues to be a topic of debate among various sources despite the flag confirmation. Monthly fluctuations may also play a significant role in this ongoing discussion.
-
Price movement has broken through the critical threshold and entered into the bearish territory. Surprisingly, sellers seem to have exited the market abruptly.
-
Since sellers have given up, there is minimal resistance to halt the upward price movement. Moving forward, the only sellers will be the buyers who entered long positions when this concept was introduced at 18k. The next hurdle lies between 48k and 50k. If you're waiting for a drop to 10k, it might be a long wait. Weekly.
-
There are still bears commenting below about Bitcoin hitting 10k and below. Are you serious?
-
For the second time in Bitcoin's price action history, a bullish engulfing candle has appeared on the 3-month chart. The bar extension from 2017 aligns price action perfectly with the target. While the outcome remains uncertain, 2024 is anticipated to be far from uneventful.
-
Over the past few months, I have received numerous inquiries seeking my perspective on the 5.3 Theory put forth by Steve of Crypto Crew University. I have shared my detailed thoughts in a public post available here: patreon.com/posts/98094906?pr=true. In essence, I have not been able to refute the theory.
-
The Whales express their gratitude to retail liquidations for providing liquidity at 62-63k for long orders, influencing active trades.
-
Get ready for some intense price action as jaws drop with the upcoming market move. Keep an eye on the daily chart for updates.
-
Price action on the chart has recently established strong support, confirming previous resistance levels. Another confirmation is anticipated by May 27th, as mentioned in previous communications. This ongoing bull market is notably met with resistance and skepticism from many traders who are awaiting further price dips. However, successful trading requires patience and proactive decision-making to capitalize on market opportunities. Stay tuned for weekly updates and insights.
-
Many inquiries are being made about the validity of this concept. Rest assured, it is not void.
-
The swing weekly low print has been validated, indicating a trade active situation. The anticipated target area is projected to be reached around the September period unless there are any unforeseen developments.