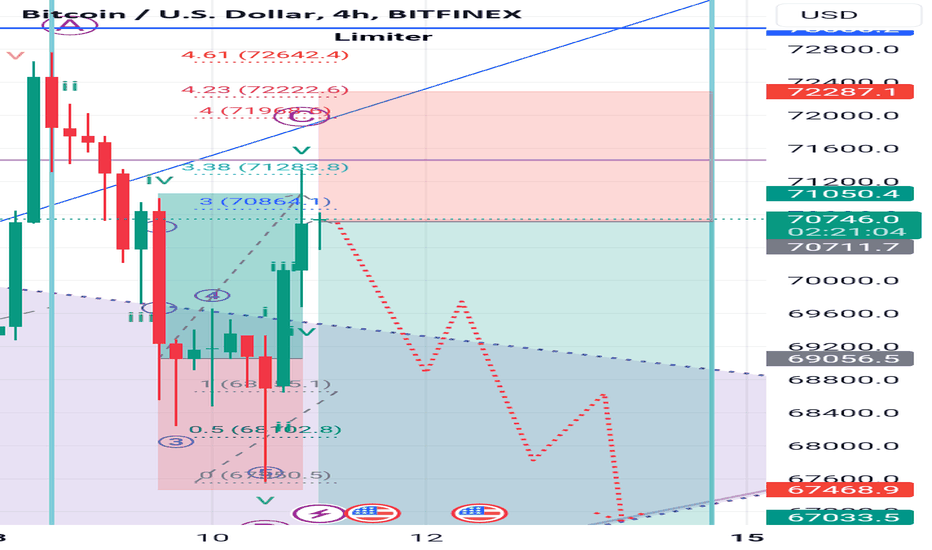
ABC correction completed, anticipating the formation of a bearish Elliott Wave within the triangle pattern. This pattern consists of the Fifth peak of an Elliott Wave and the ABC correction. Fibonacci retracement levels (on the H4 timeframe) are applied from peak 2 to peak 0 of the Elliott Wave. On the H1 timeframe, Fibonacci retracement is calculated from peak 4 to peak 2. This adjustment is necessary due to the Fibonacci 300% level being too low from peak 2 to peak 0.
Keep in mind that whales are currently accumulating, indicating that selling could pose significant risks.
Trade active:
I have traced the retracement path, although it may not be entirely accurate. Nevertheless, it is well-constructed. The retracement is based on a consistent 0.70% from the previous lower low (LL), utilizing only the Fibonacci 100% level for this calculation. I have adjusted the stop loss (SL) above the higher high (HH) or placed it closer. Furthermore, I have set the take profit (TP) at the 338% level.
My stop loss was hit swiftly, like a rabbit being targeted by an arrow.
Working on a new Elliott Wave analysis based on the recent higher high...
I have conducted an analysis on the H4 time frame and all indicators are looking good. However, the bearish trend has been confirmed. I have entered a trade at this point, but it may be advisable for you to consider waiting for the chart to reach around 70.5k or higher before selling.