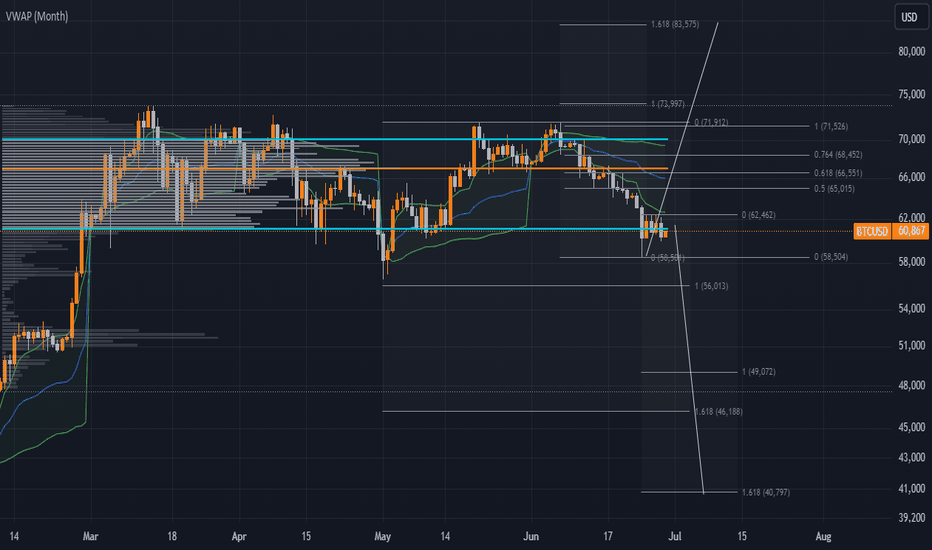
Price Levels:
The current price of Bitcoin is around $60,830.
VWAP Levels:
The VWAP (Volume Weighted Average Price) for the month is shown with three lines:
Fib Retracement Levels:
The significant Fibonacci retracement levels are marked, with key levels at:
- 0.236 (62,462)
- 0.382 (58,504)
- 0.5 (56,013)
- 0.618 (53,522)
- 0.764 (50,058)
- 1.618 (40,797)
Volume Profile:
The volume profile is shown, indicating high trading activity around certain price levels, especially between $60,000 and $70,000.
Trendlines and Projections:
A downward projection suggests possible lower targets.
Potential bullish target projection upwards, aiming towards $83,575 if a reversal occurs.
Moving Averages:
Short-term and long-term moving averages are included, suggesting a bearish trend as the current price is below the VWAP.
Analysis:
Current Trend:
The price is below the VWAP, indicating bearish sentiment in the short term.
The downward projection line suggests a potential further drop if the current support levels do not hold.
Support and Resistance:
Support: Around $58,504 (0.382 Fib level) and $56,013 (0.5 Fib level).
Resistance: The VWAP levels at $62,643, $66,021, and $69,398 act as resistance.
Price Projections:
If the price breaks below $58,504, it could drop further to the next support levels at $56,013 or even $53,522.
A bullish reversal above $62,462 could aim for the VWAP levels and possibly higher to $83,575.
Trading Strategy:
Short Positions: Enter if the price breaks below $58,504 with targets at $56,013 and $53,522.
Long Positions: Consider entering above $62,462 with targets at $66,021 and $69,398. Further confirmation is needed for a strong uptrend towards $83,575.
In summary:
Bitcoin is currently in a bearish trend with significant resistance levels to overcome. The support levels should be closely monitored for potential drops, while a breakout above the resistance could indicate a reversal.