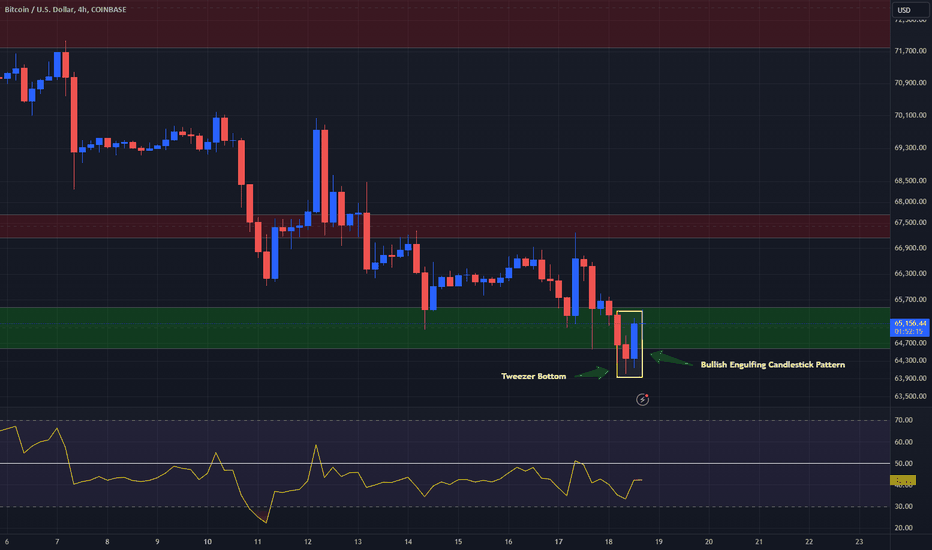
Bitcoin is currently being analyzed on the 4-hour chart, showing signs of consolidation in the overall daily chart. The price has consistently been supported within the range of $64,500 to $65,500. The bullish bias is primarily driven by technical analysis indicators such as the Tweezer Bottom and the formation of a Bullish Engulfing Candlestick Pattern at a notable support level.
In the broader perspective, to anticipate a favorable upward movement in Price, it is crucial to observe a substantial Daily Bullish Candle formation. This can either manifest as a "Bullish Engulfing" pattern or, in the event of a day of consolidation, a "Morning Star/Morning Doji Star" Candlestick Pattern. The confirmation of bullish momentum is essential for making informed decisions in this market.