BTC/USD Daily Chart Analysis
Trend Analysis:
- The daily chart displays a persistent bullish trend characterized by higher highs and higher lows since late last year.
- Although experiencing some consolidation and volatility recently, the price has managed to stay above crucial support levels.
Support and Resistance Levels:
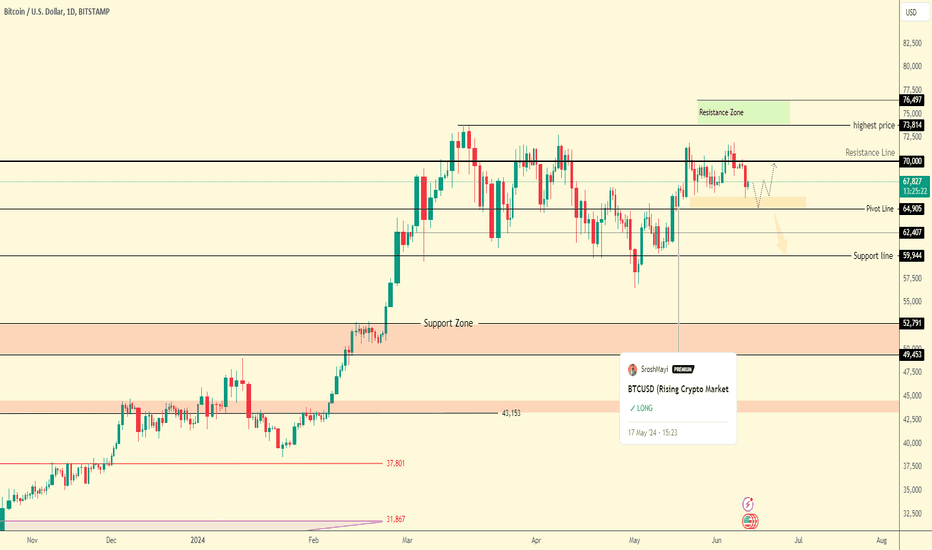
- Immediate Support Level: 65,000, serving as a robust support in case of a price retreat.
- Next Support Level: 62,400, a significant support level previously tested.
- Immediate Resistance Level: 70,000, potentially hindering upward movements.
- Next Resistance Level: 73,800, a critical resistance level aligned with recent highs.
Technical Indicators:
- Recent price action and candlestick patterns indicate consolidation within a bullish framework.
- Positive overall momentum suggests the potential for further upward movements.
Direction Preference:
Considering the current bullish trend and higher time frame, a bullish trend is favored for BTC/USD in the short to medium term. The price is expected to progress towards resistance levels at 70,000 and possibly 73,800.
Key levels to watch:
- Pivot Price: 66,120
- Resistance: 70,000, 73,810, 76,500
- Support: 64,900, 62,400, 59,940
Conclusion:
The BTC/USD daily chart supports a bullish trend with ongoing upward momentum. It is recommended to explore long positions, targeting resistance levels at 70,000 and 75,000. Keep an eye out for consolidation or pullback signals; however, the current bullish trend remains favorable for today and the near future.
The trade is active: the price has undergone a correction and is now continuing.