bitcoin
Quote from last week:
comment:
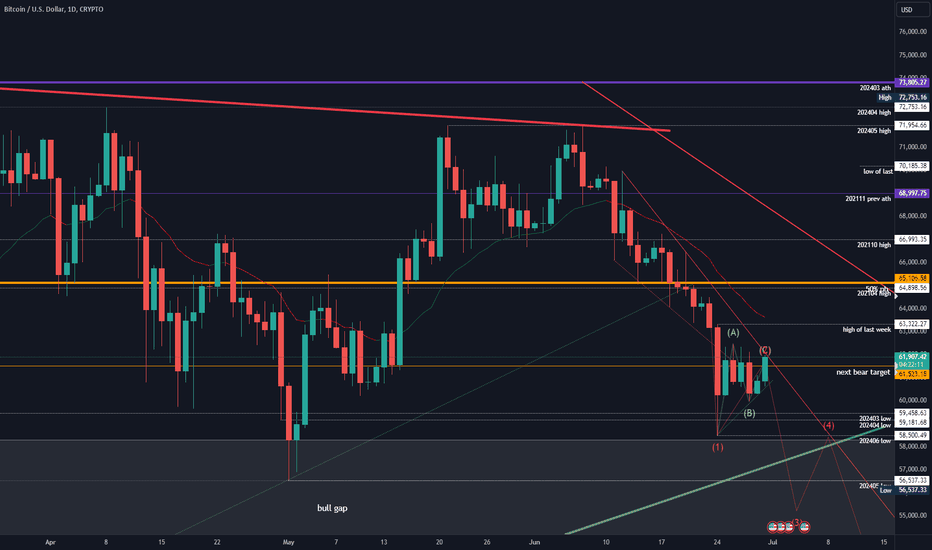
Guess what. Anyone looking at this chart who tells you to buy for anything higher than 66000 is a permabull in denial. The last time a daily bull bar closed above its midpoint was almost 3 weeks ago. The bull trend line from 2024-02 is clearly broken. Market touched the weekly 20ema and bounced some but bulls could not get any follow through, what so ever. Bears are not that strong either tbh, just grinding this down. At some point one side will give up for a huge drop/bounce. Until bulls can make higher highs above 66500 again, you should not be looking to buy this imo. So what’s next? I expect more sideways to up movement until we reach the upper bear channel and/or the daily ema gain, where I will look for shorts again. Targets below are 61000 and if that does not hold, 56000-58000 is next.
comment:
58500 was the low of the week. Since May or longer I have been writing that we will hit 58000/60000 again and above 70000 was nothing but rejection for the bulls. The amount of permabulls who are telling you to buy a clear bear trend is astonishing. It’s one thing to be bearish near all time highs but it’s whole different animal to tell people to buy when all the market does is falling. At least I give you both sides of the market and why you should not try to pick tops or bottoms. Your job as a trader is to follow what the chart is obviously trying to tell you. Not to guess what will happen next and enter trades before you have confirmation. The only use for assumptions and outlooks is to be prepared to take the signal when it appears. You want to dumb down your trading and execute like a machine because machines are probably doing ~90% of all trading.
What could happen next for bitcoin?
Market has not touched the daily 20ema for more than two weeks. The upper bear trend line will get hit soon, where I expect another rejection at that price level above 61700, like the previous 5 days. The breakout below the previous bear wedge was strong enough that this is a new trend and we are currently forming the channel with this pullback. Once market makes a new low, we know where to draw the channel lines. Odds heavily favor the bears to retest below 59000 and testing the bull trend line from 2023-10
current market cycle:
Trading range until clear break below 56000. Smaller bear trend inside this trading range could have accelerated with Monday’s breakout but we won’t know until we make lower lows below 56500.
key levels:
58000 - 63000 small range / 56000 - 74000 (big range)
bull case:
Bulls need to break above the bear trend line currently at 62000. Until then, they have nothing going for them. If they do, daily 20ema 63400ish is next. Invalidation is below 58000.
bear case:
Bulls finally gave up on Monday and we saw a huge sell vacuum down to 58500, where bulls bought it. Market tried to bounce higher since then but bears keep rejecting everything above 61700. Bears want to test the 2023-10 bull trend line and see how many buyers are there. Bears are in full control of this market. Invalidation is above 63500.
short term:
Bearish. Odds favor to turn around near the bear channel line down to retest the lows.
medium-long term:
Down to 50000 (could take 1-3 months). Longer term than that time frame, I don’t know. Could also drop to 30000 again but let’s make 40000 first and see how many want to buy there. update: reduced time frame
current swing trade:
None. Caught most of the move on Monday and my room caught a good chunk of it.
chart update:
Added the 3 bull gaps we left behind on the move up since 2023-10. Also added my preferred wave series down to close the closest gap.