This is the BTC 1 Day chart I drew the zig zag lines using the same time frame it took to make the initial bars.
What is interesting about this formation is it lines up with the 200 days or so of sideways chop we always experience after a halving - along with a Nov breakout (which would fall in line of the USA election dates).
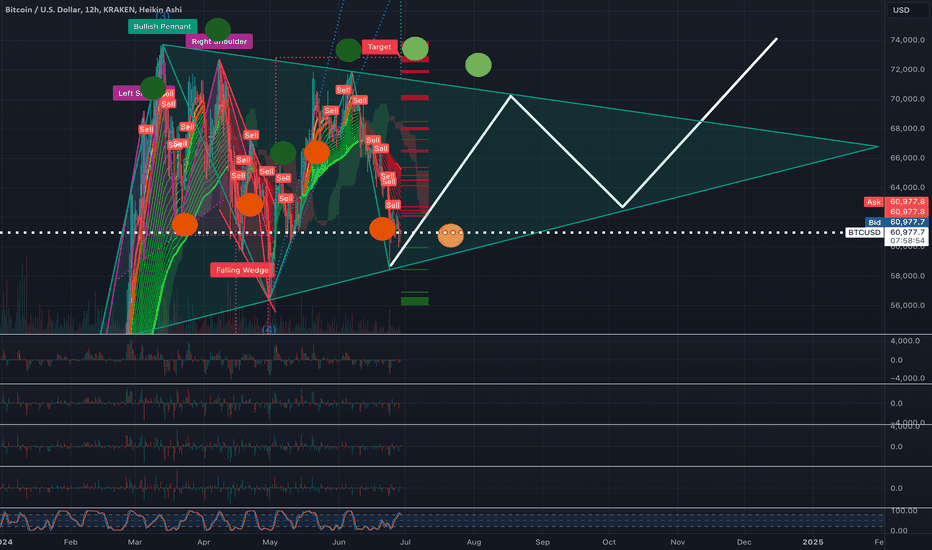
Bullish Pennant on 1D chart est price opinion for. 20th Aug $70,1K / 06th Oct 62.5K / 12th Nov end of Pennant breakout.... (Possibly Aug - if we are lucky)